Now, with the introduction of vaccines for Covid-19, quite some people want to scrutinize the tests which have been performed for checking safety of those vaccines.
These tests are generally done in the form of a double-blind study.
Here I show you how you can read and interpret the reports of such a test properly.
First, a brief introduction what a double-blind study is:
A double-blind study is a statistical experiment.
You randomly split the set of participants in two (or more) groups. Random splitting is important to avoid any selection bias!
One group gets the treatment that’s to be tested, and the second group gets a placebo, i.e., something that looks like a treatment but does not actually contain the drug or vaccine.
Then you observe certain things for each participant, e.g., whether some symptoms are present.
For each thing, you count how many participants are affected in each group.
This gives you a table like this:

Taken from https://www.nejm.org/doi/suppl/10.1056/NEJMoa2034577/suppl_file/nejmoa2034577_appendix.pdf
This table has three columns.
The first column describes the thing that has been observed.
The second column describes for how many participants of the group which got the treatment this thing occurred, and its percentage in parentheses.
The third column describes for how many participants of the group which got the placebo this thing occurred, and its percentage in parentheses.
If this thing occurs roughly with the same percentage for each group, then this shows that the occurrence of this thing does not depend on the actual treatment. I.e., it has probably happened independently.
If there is a significant difference between the percentages, then this shows an effect of the treatment. (either a desirable effect or an adverse effect. It works both ways)
Now, the terms “roughly” and “significant” are quite fuzzy. And we can do better than that.
There is a mathematical method to determine how significant such a difference actually is. The measure of significance is called “confidence”.
This depends on the difference of the percentages and on the absolute number of such events.
(That’s why we need many participants in a study to have more certainty about the result.)
Luckily, you don’t need to understand the math behind it.
There are software tools which can do the math for you.
And, the math is the same for all kinds of statistical experiments,
such as the statistical experiments done in direct response marketing, e.g., pay per click marketing.
Luckily there is a free tool to do that math for you:
E.g. SplitTester
I show you how to interpret the numbers from the double-blind study using SplitTester:
Let’s for example check the “life-threatening” under “Any event”. This occurred for 21 out of 21621 participants for the vaccine, and for 24 out of 21631 participants for the placebo.
This is about 0.1% on both sides as stated in the report. (or 0.0971% vs 0.1110% when rounded to 4 digits: 21*100/21621 is 0.0971%, …)
Now we enter those numbers into the splittester tool.
In the “Number of Clicks” field, we enter the number of events. For the math it does not matter whether we have “clicks” or any other form of event.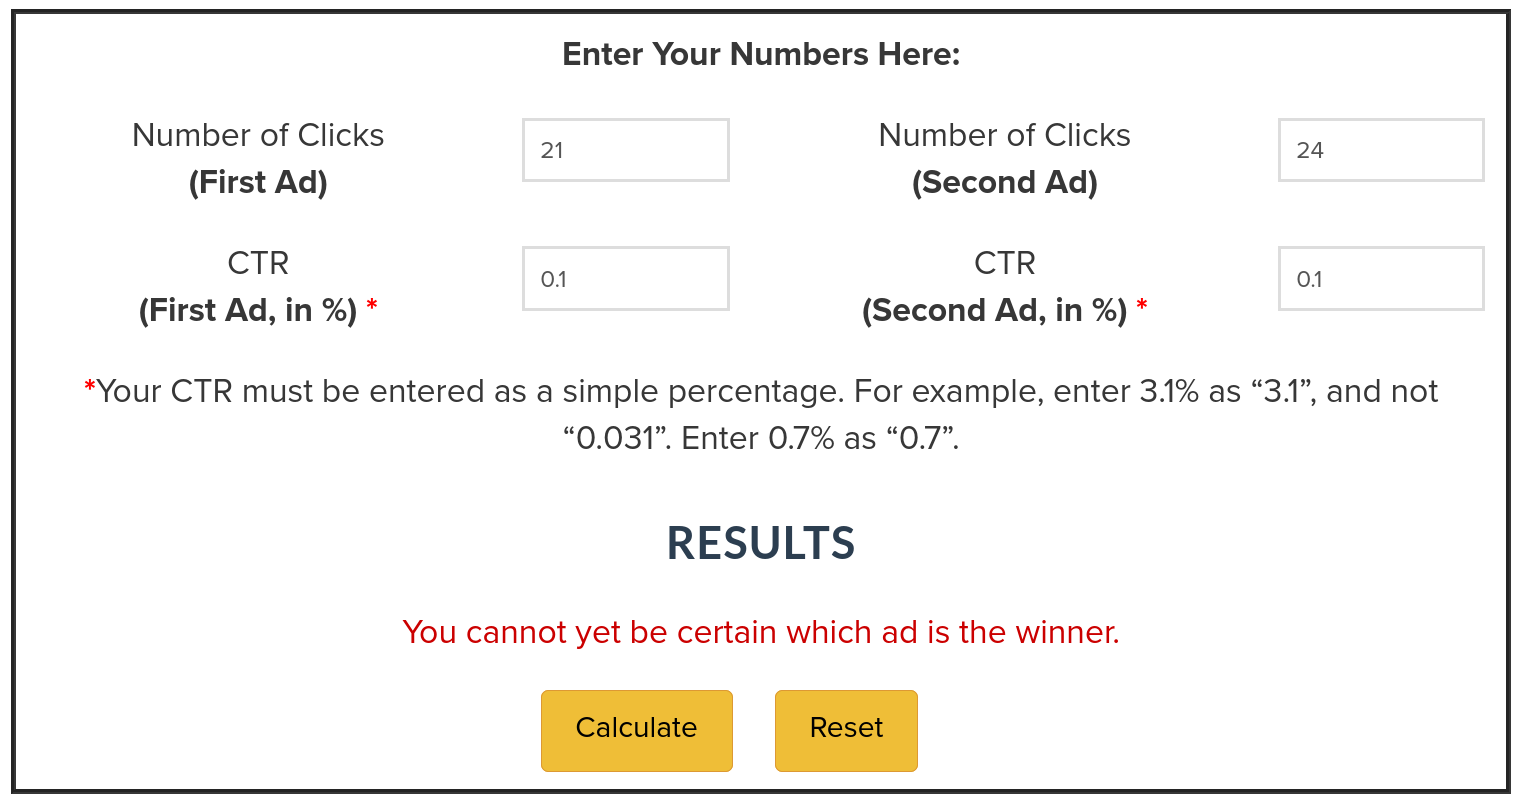
This shows that we cannot be certain which “ad” is the winner. Instead of ads, we test treatments here, but the math is the same.
Even when adding the more precise percentages, it shows the same:

That’s why the percentages in those reports are rounded to only one digit. It is usually not relevant to have more precision when the number of participants is roughly 20000 for each group.
Though in corner cases, using the exact percentage may make a difference. So, in doubt, use the exact percentages.
Now, lets look at another event that shows more difference, e.g., “Any event/Severe”, which has 240 (1.1%) for the treatment and 139 (0.6%) for the placebo:

This results in “There is an approximately 99% chance that the ads will have different long term response rates.”
This means that we can be 99% sure that the treatment causes at least some events of the category “Any event/Severe”.
This does not yet show how often these events are caused by the treatment.
There is more math needed to compute the confidence that this events is caused with a certain probability. We don’t go into that sophistication here.
But you can get a rough gauge if you just subtract the two percentages.
I.e.. 1.1% – 0.6% which is 0.5%.
This means that probably about 0.5% of those getting the treatment will experience an event of type “Any event/Severe” that is actually caused by the treatment.
And there are probably an additional 0.6% of those getting the treatment which will experience the same event, but for them it is not caused by the treatment.
Please note that based on the statistical stuff, it is not possible to tell for which of those people specifically the event was caused by the treatment, and for which is was independent of the treatment. This needs other methods, and it may be difficult or impossible to do so.
I hope this explanation helps you to read and interpret those reports.
If you have any questions, please leave a comment below.
If you spot any errors in my explanation, please leave a comment, too.